When the production manager at Kalinga Paper Mills in Bhubaneswar opened his electricity bill last March, the power factor penalty stared back at him like a recurring nightmare: Rs.4.2 lakhs annually. With three production lines running massive pulping equipment, paper machines, and auxiliary systems, their collective power factor had dropped to 0.72 – well below the 0.9 threshold mandated by GRIDCO Odisha. Six weeks later, after deploying RPM-416 power analyzers across all three lines, they not only eliminated this penalty but achieved a consistent power factor of 0.95.
This isn't just another success story – it's a blueprint for how modern power analyzers and data loggers are revolutionizing energy management in India's industrial sector.
The Hidden Energy Crisis in Indian Industries
India's industrial sector consumes over 45% of the country's total electricity, yet studies by Bureau of Energy Efficiency indicate that 20-30% of this consumption stems from poor power quality, inefficient load management, and lack of real-time monitoring. Paper mills, textile plants, steel foundries, and chemical facilities across states like Tamil Nadu, Gujarat, Maharashtra, and Odisha face mounting pressure from:
- Power Factor Penalties: State electricity boards impose penalties ranging from 1% to 2% per unit for every 0.01 drop below 0.9 PF
- Demand Charges: Peak demand violations can cost Rs.200-400 per kVA of excess demand
- Harmonics & Voltage Fluctuations: Leading to equipment failures, production downtimes, and reduced motor life
- Energy Audit Compliance: PAT (Perform, Achieve & Trade) scheme mandates continuous monitoring for designated consumers
Why Standard Protection Fails in Process Industries
Traditional energy meters and basic protection relays provide snapshot readings but fail to capture the dynamic nature of industrial loads. A paper mill's power consumption varies dramatically during different production phases – pulping, pressing, drying, and winding. Similarly, a steel rolling mill experiences massive current surges during billet heating and rolling operations.
Standard meters cannot:
- Log power quality parameters over extended periods
- Identify harmonic distortions from variable frequency drives
- Track demand patterns for optimization
- Provide data granularity required for energy audits
- Monitor multiple parameters simultaneously across different production lines
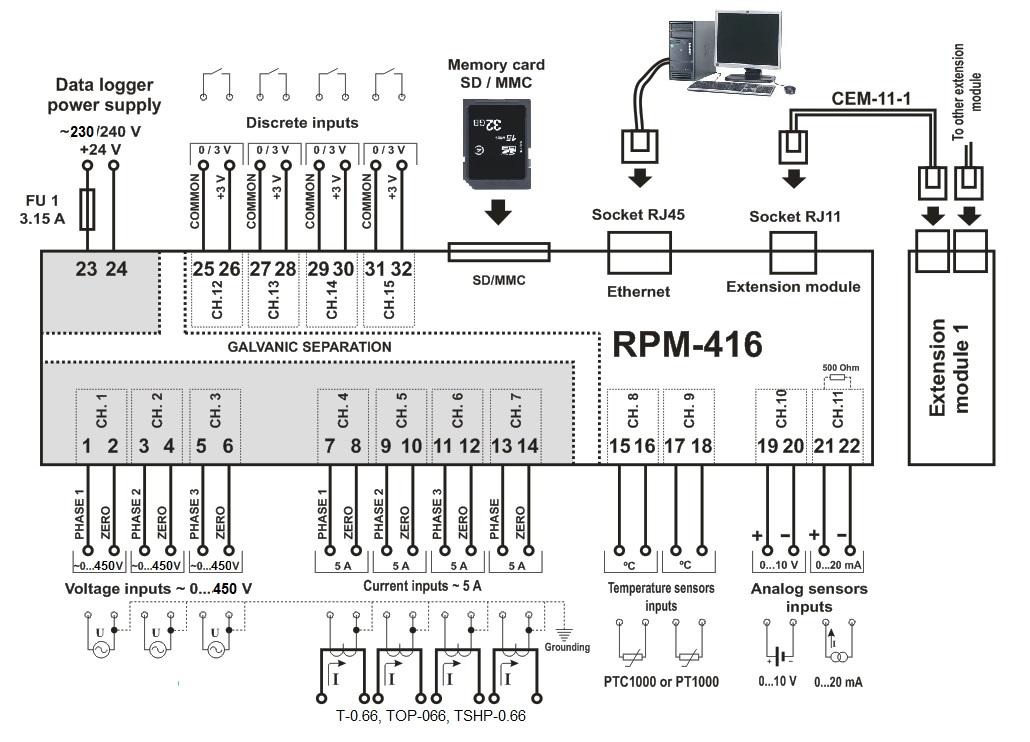
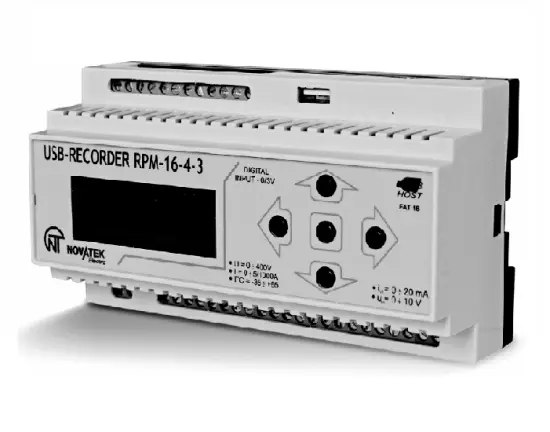
RPM-416 & RPM-16-4-3: Purpose-Built for Indian Industrial Conditions
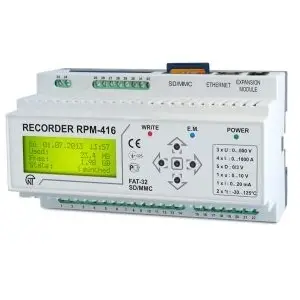
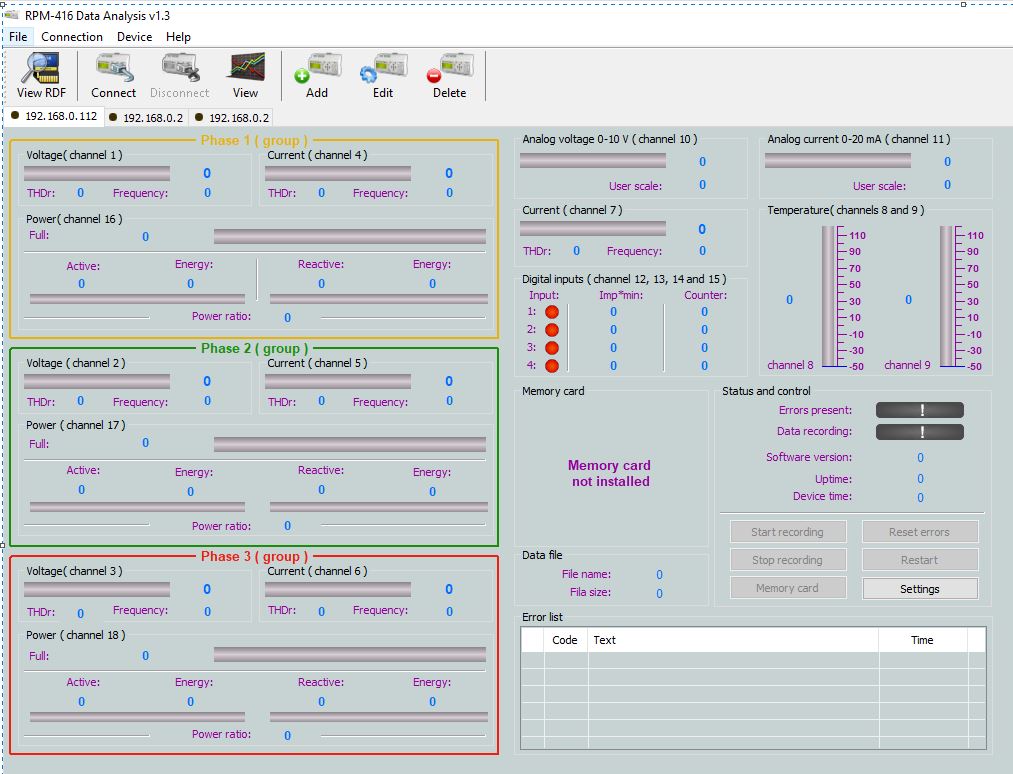
Our RPM-416 Power Quality Analyzer and RPM-16-4-3 Data Logger represent 30+ years of engineering experience in Indian industrial environments. Unlike imported solutions that struggle with voltage fluctuations and ambient temperatures, these devices are designed for the harsh realities of Indian manufacturing.
| Parameter | RPM-416 | RPM-16-4-3 |
|---|---|---|
| Input Voltage Range | 85-265V AC/DC | 85-265V AC |
| Input Channels | 15 channels total | 16 channels total |
| Sampling Rate | 1ms to 3600s programmable | 1s to 3600s programmable |
| Memory | 32GB SD card support | 16GB flash drive support |
| Operating Temperature | -10°C to +55°C | 0°C to +50°C |
| Communication | Ethernet | - |
| Ex-GST Price | Rs.45,000 | Rs.20,142 |
Real-World Applications with Technical Details
1. Power Factor Correction & Penalty Elimination
At Kalinga Paper Mills, the RPM-416 revealed that their power factor dropped to 0.65 during peak pulping operations (2-4 PM daily). The analyzer's 1-millisecond sampling rate captured reactive power spikes from their 2.5MW pulping motors. By installing automated capacitor banks triggered by RPM-416's relay outputs, they achieved:
- Power factor improved from 0.72 to 0.95
- Annual penalty elimination: Rs.4.2 lakhs saved
- Reduced transformer losses by 12%
- Payback period: 8 months including analyzer cost
2. Peak Demand Management
A textile mill in Tirupur deployed RPM-16-4-3 across their spinning, weaving, and dyeing sections. The data logger identified that all three sections peaked simultaneously between 10-11 AM, pushing demand to 4.8MW against their sanctioned load of 4.2MW. By staggering operations based on logged data:
- Peak demand reduced to 4.1MW
- Avoided demand penalty of Rs.1.2 lakhs/month
- Improved load factor from 0.73 to 0.86
3. Energy Audit & PAT Compliance
A steel rolling mill in Raipur required detailed energy consumption data for PAT compliance. RPM-416's multi-channel logging capability tracked:
- Induction furnace energy consumption: 450 kWh/tonne of steel
- Rolling mill energy: 85 kWh/tonne
- Auxiliary equipment: 35 kWh/tonne
- Total specific energy consumption: 570 kWh/tonne (15% reduction achieved through optimization)
4. Harmonic Analysis & Equipment Protection
A chemical plant in Gujarat faced frequent VFD failures due to harmonic distortions. RPM-416's power quality analysis revealed 23% Total Harmonic Distortion (THD) during certain process cycles. Installing line reactors reduced THD to 5%, eliminating equipment failures and saving Rs.8.5 lakhs annually in replacement costs.
5. Billing Verification & Utility Dispute Resolution
A paper mill in Kerala disputed their electricity bill showing 15% higher consumption than expected. RPM-416 data logs proved that utility meter calibration was incorrect during high-load periods. The logged evidence helped recover Rs.12 lakhs in overbilling and corrected future billing accuracy.
6. Load Balancing Across Multiple Feeders
An automobile component manufacturer in Chennai used RPM-16-4-3 to monitor three incoming feeders. Data analysis revealed 25% load imbalance, causing neutral current flow and increased losses. Redistributing loads based on logged patterns reduced energy consumption by 8%.
IS/IEC Standards Compliance
Both RPM-416 and RPM-16-4-3 comply with:
- IEC 61000-4-30 Class A: Power quality measurement accuracy
- IS 13585: Indian standard for power quality analyzers
- IEC 61010-1: Safety requirements for electrical equipment
- IS 732: Code of practice for electrical wiring
- Central Electricity Authority (Technical Standards) Regulations: Power factor and harmonic limits
Quick Selection Guide
| Application | Recommended Model | Price (Ex-GST) |
|---|---|---|
| Comprehensive Power Quality Analysis | RPM-416 | Rs.45,000 |
| Basic Energy Monitoring & Logging | RPM-16-4-3 | Rs.20,142 |
| Multi-line Process Monitoring | RPM-416 + RPM-16-4-3 | Rs.65,142 |
Cost-Benefit Analysis for Process Industries
Based on deployments across 500+ industrial installations, typical ROI includes:
| Benefit Category | Annual Savings | Implementation Cost | Payback Period |
|---|---|---|---|
| Power Factor Penalty Elimination | Rs.2-8 lakhs | RPM-416: Rs.53,100 (incl. GST) | 3-6 months |
| Demand Charge Optimization | Rs.1-5 lakhs | RPM-16-4-3: Rs.23,768 (incl. GST) | 4-8 months |
| Energy Efficiency Improvement | 5-15% of electricity bill | Complete monitoring setup | 8-18 months |
| Equipment Life Extension | Rs.3-12 lakhs | Power quality analysis | 6-12 months |
Why Novatek Electro for Power Monitoring Solutions?
- ISO 9001:2015 Certified: Quality management system ensures consistent product reliability
- CE Certified: European conformity standards for electrical safety and EMC compliance
- Made in India: Designed for Indian industrial conditions with local support infrastructure
- 30+ Years Experience: Deep understanding of Indian power systems and industrial requirements
- Nationwide Support: Service centers across major industrial hubs with local engineering support
- Competitive Pricing: 40-60% cost advantage over imported alternatives without compromising quality
Frequently Asked Questions
Ready to Eliminate Power Quality Issues?
Join 500+ satisfied customers who have deployed RPM-416 and RPM-16-4-3 across their facilities. Get expert consultation, competitive pricing, and nationwide support.
Contact us today:
🌐 Online Store: https://intelli-electro.com
📧 Email: sales@novatek-electro.in
📱 Phone: +91-7840054744